I’m back by popular demand with my spend analysis for 2025! This year had a few improvements like using the Other category exclusively for MS and using Gemini to do some tedious work like tally up all of my Venmo transactions and gather which cards were used most in each category. Thanks AI!
If you haven’t read my 2024, 2023 and 2022 Spending Recaps, they can be found below.
Disclaimer: I find being transparent about finances to be valuable so these are my actual metrics. I am not doing this to brag in any way. I just hope that my insights can somehow help other and help myself be smarter about my money.
The Totals
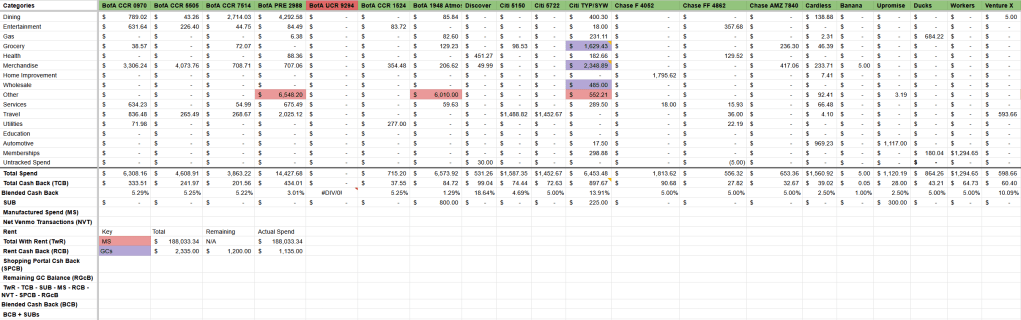
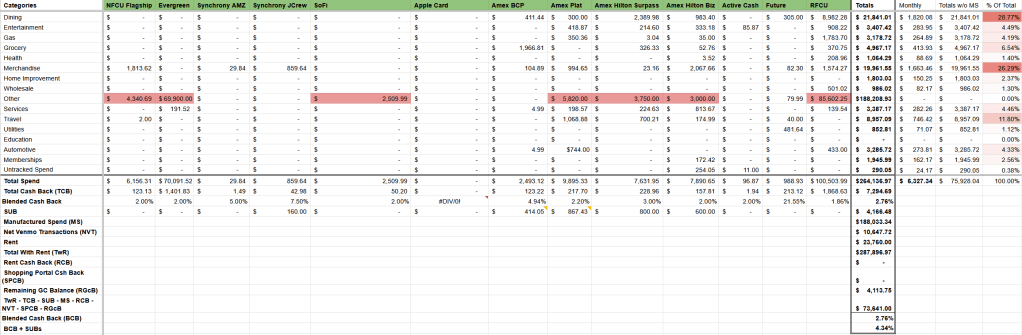
2025 Spend Recap Spreadsheet
I’ve opened so many cards at this point I’ve had to split the screenshot into two to make it more legible
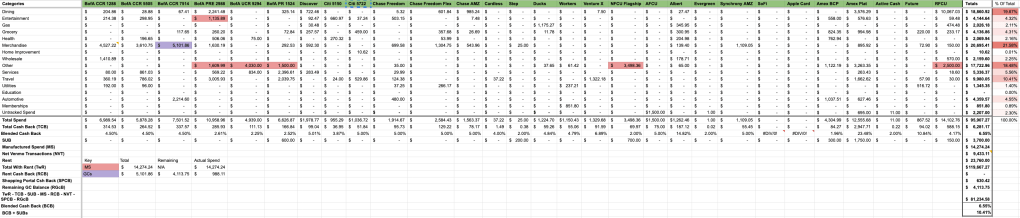
2024 Spend Recap Spreadsheet
2023 Spending Recap Spreadsheet

2022 Spending Recap Spreadsheet

2021 Spending Recap Spreadsheet

Once again, if all you care about is the raw numbers, you can stop reading. The rest of this document will go into a breakdown of each category, some notes I have about each and finally a comparison to how this year stacked up against last year.
I’ve made my spreadsheet tracking of year over year change more robust so in lieu of my normal HTML table, here is a screenshot!
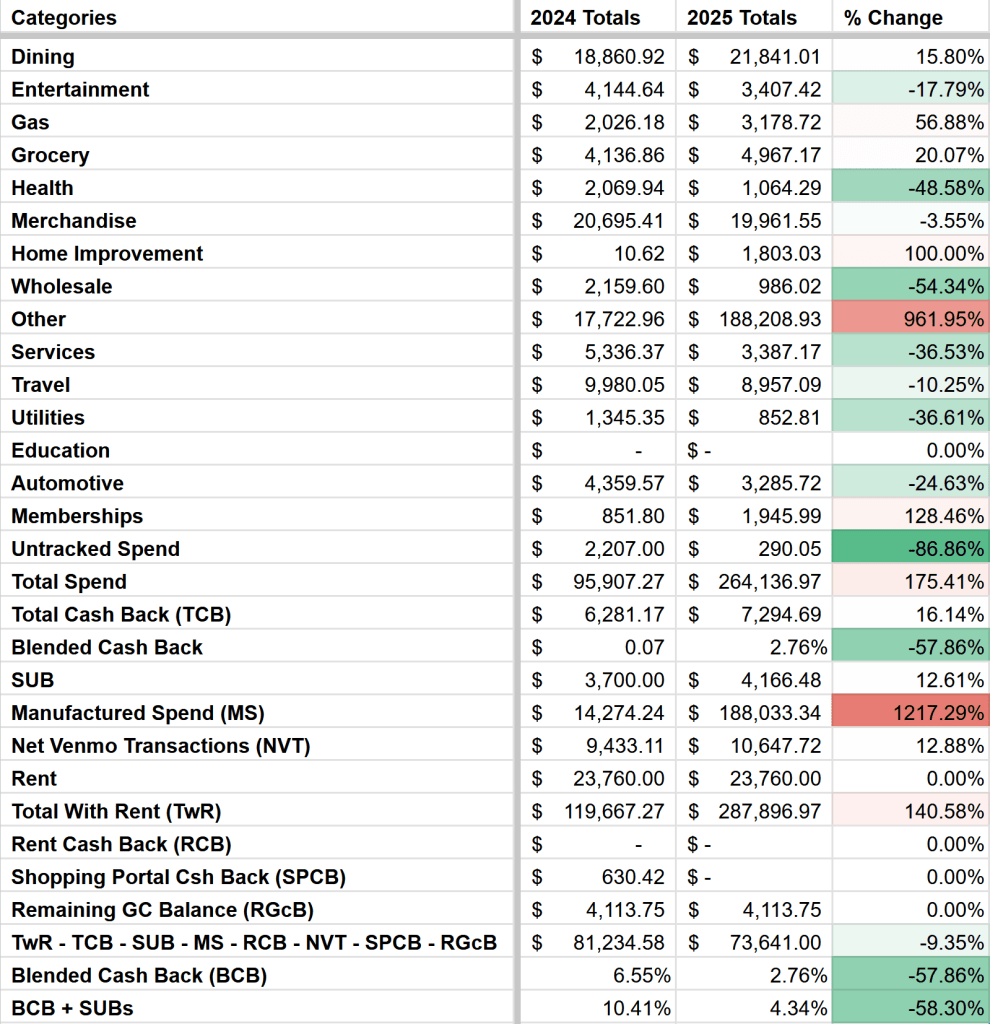
If the color gradient in the % Change column wasn’t clear enough, we are seeing some large changes from last year! And positive changes if you ask me.
Year over year I normally spend the same but this is the first year, after deductions of fake spend such as MS etc, I spent LESS than last year! Additionally, some of this spend is still inflated including business spend from both the podcast and my vinyl selling (inventory purchasing).
Same with previous years, my income again went up YoY both with my full time job and my side hustle revenue has gone up as explained in Episode 68.
Asterisks
Wanted to give some asterisks behind this data before we dive in. These are mostly the same as previous years so feel free to skip this section.
Cash Back is Estimated
Most of my banks issue some form of year end summary but none of them offer the same for cash back. To calculate cash back, I do rough estimates based on categories and what I use the cards for. For example, I assume a flat 5% for cards like the Citi Custom Cash and Chase Freedom/Flex because I always optimize my spend to only be on these cards when they will earn 5%. Others like the Future card are accurate as I added up all the offers I earned throughout the year. Something like my Hilton cards are a sort of arbitrary number as it is hard to determine the true cash equivalent value for those points and for the spend I put on those cards.
Lots of Spend Reimbursed
You will notice Net Venmo Transactions (NVT) as a line item. This is spend I made but was reimbursed from friends/family for. Most of these transactions, I retain the cash back but sometimes on larger purchases I will send them a cut/all of it. This cash back is still counted in my totals even though I may have paid it off.
Bank Account Funding (BAF) has been renamed to Manufactured Spend (MS)
The large uptick in CC spend that is not present in the true total spend is mainly due to bank account funding but felt it was clearer if I just called it MS as that is what it is. These are signified in red in the key and table and are all within the Other category. This year saw a MASSIVE uptick in MS which I am quite happy to see.
Remaining GC Balance (RGcB)
When Pepper was booming I felt the need to track these separately. You will see a color legend for gift card purchases (purple) and see that color in the table. I went and tracked how many of those GCs were used and which I have outstanding balances for. If they have an outstanding balance. I didn’t consider those spend since I still hold the value. Accountants hate me!
MCC Dependancy
All of these categories are taken from MCCs from the transactions. These can not only be wrong but can vary from network. I know that some automotive spend leaked into other categories but eeteeswhateetees.
Spend by Category
Note that for % of total I have started to exclude MS from my total as this year MS accounted for over 70% of my CC spend which would make the other %s useless.
Dining
| Year | Spend | % Of Total | YoY |
|---|---|---|---|
| 2025 | $21,841.01 | 28.77% | 15.80% |
| 2024 | $ 18,860.92 | 19.67% | 39.46% |
| 2023 | $13,524.65 | 17.07% | 18.43% |
| 2022 | $11,419.88 | 14.48% | – |
Dining includes things like restaurants, fast food, bars and other specialty food restaurants. This is unfortunately another large uptick from last year. I still mostly buy my lunches while in office and put my card down and request friends via Venmo for group dinners for the points.
Since my RFCU card has been a target for a lot of my MS (and the nerfing of the categories) I have shifted my spend of late with my top cards being: RFCU (41.13%), BofA PRE (19.65%), BofA CCR (12.43%). I have set one of my CCRs to Dining for this reason. The PRE is used internationally (went to Portugal) and when I am paying for a large friend dinner.
Entertainment
| Year | Spend | % Of Total | YoY |
|---|---|---|---|
| 2025 | $3,407.42 | 4.49% | -17.79% |
| 2024 | $ 4,144.64 | 4.32% | 8.95% |
| 2023 | $3,804.14 | 4.80% | -40.97% |
| 2022 | $6,444.68 | 8.17% | – |
A decent reduction from last year. Maybe I went to less concerts but it didn’t feel like I had less “entertainment” this year.
Spend this year went to: RFCU (26.65%), BofA CCR (18.54%), Amex Plat (12.29%). Amex for offers associated with the purchase or the SUB/retention offer, CCR is set to online and RFCU was used at a spa in Canada hoping it might code with a higher multiplier.
Gas
| Year | Spend | % Of Total | YoY |
|---|---|---|---|
| 2025 | $3,178.72 | 4.19% | 56.88% |
| 2024 | $2,026.18 | 2.11% | -22.12% |
| 2023 | $2,601.55 | 3.28% | 15.45% |
| 2022 | $2,253.31 | 2.86% | – |
Gas took a large uptick this year. Thinking back I did do a lot of driving – drove to Canada, drove in Portugal and traveled to and from New Jersey often.
Spend was on: RFCU (56.11%), Ducks (21.53%), Amex Plat (11.02%)
Grocery
| Year | Spend | % Of Total | YoY |
|---|---|---|---|
| 2025 | $4,967.17 | 6.54% | 20.07% |
| 2024 | $4,136.86 | 4.31% | -12.58% |
| 2023 | $4,732.11 | 5.97% | 115.67% |
| 2022 | $2,194.17 | 2.78% | – |
Groceries were up this year which I am happy about – but with it I would expect to spend less on dining. Additionally, $1400 of this spend was on GCs so my real grocery spend is actually ~$3500. I need to cook more. I still eat plenty of berries but I went through a stretch of not cooking much. I am back at it a bit but want to cook more still. Here’s hoping this is up next year!
As for cards: Amex BCP (39.6%), Citi TYP/SYW (32.8%), RFCU (7.46%). The Citi spend is misleading as the GC spend was done on it for it’s spend bonuses.
Health
| Year | Spend | % Of Total | YoY |
|---|---|---|---|
| 2025 | $1,064.29 | 1.40% | -48.58% |
| 2024 | $2,069.94 | 2.16% | -3.47% |
| 2023 | $2,144.42 | 2.71% | 109.11% |
| 2022 | $1,025.48 | 1.30% | – |
Spend is back to 2022 numbers! No massive injuries this past year. For 2026 I elected for a higher insurance plan at work so this number may shrink even more.
Spend: Discover (42.4%), RFCU (19.63%), Citi TYP/SYW (17.16%). Discover was for CVS purchases which also include some GCs
Merchandise
| Category | Spend | % Of Total |
|---|---|---|
| General Merchandise | $19,961.55 | 26.29% |
| Home Improvement | $1,803.03 | 2.37% |
| Wholesale | $986.02 | 1.30% |
| Gift Cards | $2,335.00 | 3.07% |
| Total Merchandise | $22,750.60 | 29.96% |
| Year | Spend | % Of Total | YoY |
|---|---|---|---|
| 2025 | $22,750.60 | 29.96% | -.5% |
| 2024 | $22,865.53 | 21.58% | 9.97% |
| 2023 | $20,793.03 | 26.18% | -41.69% |
| 2022 | $27,436.72 | 34.70% | – |
Although I started buying vinyl records for business purposes (see Discogs here), my merchandise spend remained the same! Meh and JCrew still make up a alrge portion of this category.
Spend: BofA CCR (20.41%), BofA CCR (16.56%), Citi TYP/SYW (11.77%). Both CCRs set to Online
Other
| Year | Spend | % Of Total | YoY |
|---|---|---|---|
| 2025 | $188,208.93 | 71.25% | 961.95% |
| 2024 | $17,722.96 | 18.48% | 259.80% |
| 2023 | $4,925.76 | 6.22% | 134.40% |
| 2022 | $2,101.47 | 2.66% | – |
It’s kind of jarring seeing nearly $200k in spend but there it is. Obviously this is a dramatic uptick from last year. Along with my normal bank account bonus MS, I have found an awesome MS avenue that I have been hitting hard. FNBO and RFCU are my targets as is evident by the cards used below.
Additionally, the MS category for previous years was not exclusively in Other like it is this year, so the real YoY should be 1217.29% for 2024 -> 2025.
Cards: RFCU (45.48%), Evergreen (37.14%), BofA PRE (3.48%). PRE is always used for bank account funding.
Services
| Year | Spend | % Of Total | YoY |
|---|---|---|---|
| 2025 | $3,387.17 | 4.46% | -36.53% |
| 2024 | $5,336.37 | 5.56% | -13.35% |
| 2023 | $6,158.47 | 6.22% | 20.71% |
| 2022 | $5,101.70 | 6.47% | – |
Tax payments are a large portion of this again although I didn’t put my mom’s taxes this year which could explain the down tick too.
Cards: Amex Hilton Biz (24.02%), BofA PRE (19.94%), BofA CCR (18.72%)
Travel
| Year | Spend | % Of Total | YoY |
|---|---|---|---|
| 2025 | $8,957.09 | 11.80% | -10.25% |
| 2024 | $9,980.05 | 10.41% | -26.70% |
| 2023 | $13,615.22 | 17.18% | 48.10% |
| 2022 | $9,193.22 | 11.66% | – |
Europe 3.0 was this year but friends and I evenly charged to our own cards and we only went to Portugal so flights were cheaper.
Cards: BofA PRE 2988 (22.61%), Citi Custom Cash (16.62%), Citi Custom Cash (16.22%). Citi is here as Airbnb counts as Travel on the Custom Cash.
Utilities
| Year | Spend | % Of Total | YoY |
|---|---|---|---|
| 2025 | $852.81 | -36.61% | 1.12% |
| 2024 | $1,345.35 | 1.40% | -32.53% |
| 2023 | $1,993.85 | 2.52% | 26.63% |
| 2022 | $1,574.50 | 2.00% | – |
My utility has stared charging a large fee for CC payments so I have moved my spend to ACH payments and spend on my Future debit card.
Cards: Future 56.48%, BofA CCR 32.48%, BofA CCR 8.44%.
Automotive
| Year | Spend | % Of Total | YoY |
|---|---|---|---|
| 2025 | $3,285.72 | 4.33% | -24.63% |
| 2024 | $4,359.57 | 4.55% | 4867.04% |
| 2023 | $87.77 | 0.11% | -97.15% |
| 2022 | $3,076.91 | 3.90% | – |
My 2014 Jeep Cherokee is still kicking AND my automotive spend went down – woohoo! Although again this is misleading as I spend ~$1k on a family members car last year so I still spend ~$3k this year on my car which is consistent. I also had some motorcycle maintenance. I did have someone dent my rear end but have not repaired it as it is just cosmetic. Maybe some day, they quoted me $900 which seems steep just for a ding.
Cards: Upromise (34.0%), Cardless (29.5%), Amex Plat (22.64%). Upromise was used to hit MSR.
Memberships
| Year | Spend | % Of Total | YoY |
|---|---|---|---|
| 2025 | $1,945.99 | 2.56% | 128.46% |
| 2024 | $851.80 | 0.89% | -19.84% |
| 2023 | $1,062.60 | 1.34% | -14.89% |
| 2022 | $1,248.45 | 1.58% | – |
Rock climbing is still the #1 spend here. When I travel home or to a new city I buy a punch pass or day pass which adds up.
Cards: Workers (66.53%), Citi TYP/SYW (15.36%), Ducks (9.25%)
Untracked Spend
| Year | Spend | % Of Total | YoY |
|---|---|---|---|
| 2025 | $290.05 | 0.38% | -86.86% |
| 2024 | $2,207.00 | 2.30% | 128.46% |
| 2023 | $3,784.89 | 4.78% | -25.79% |
| 2022 | $5,100.13 | 6.47% | – |
Super proud that this is near 0!
Takeaways
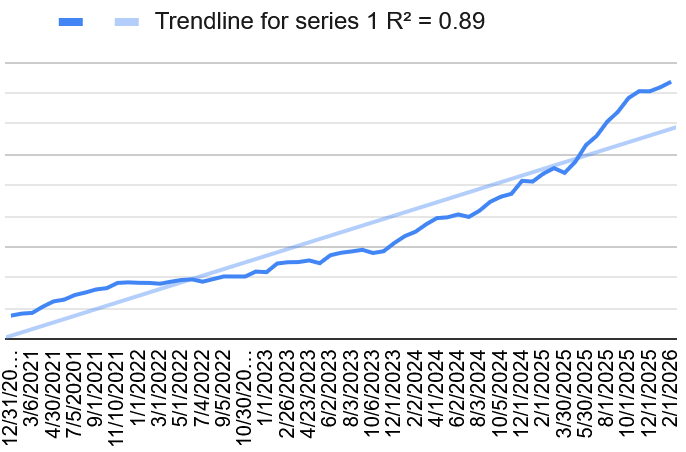
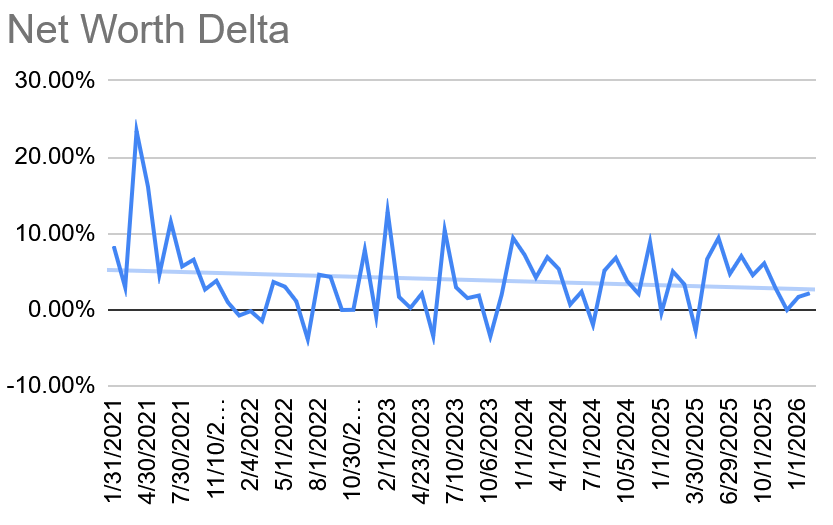
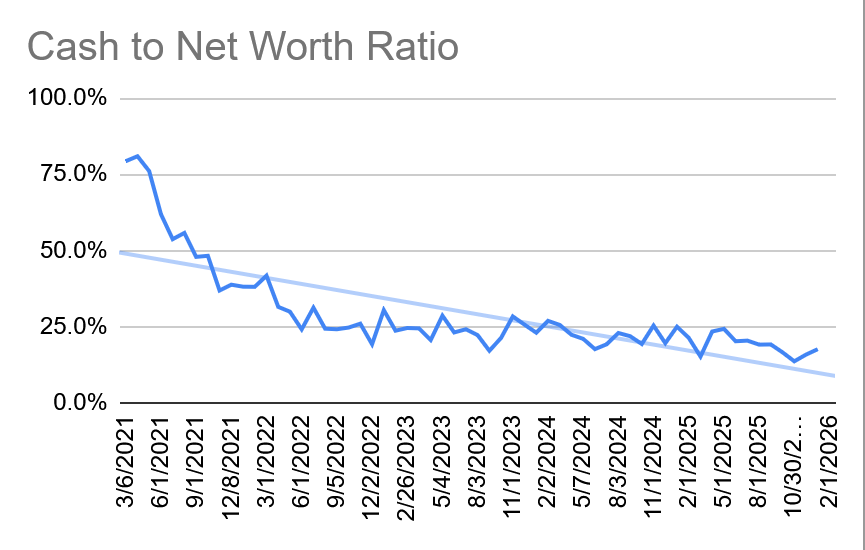
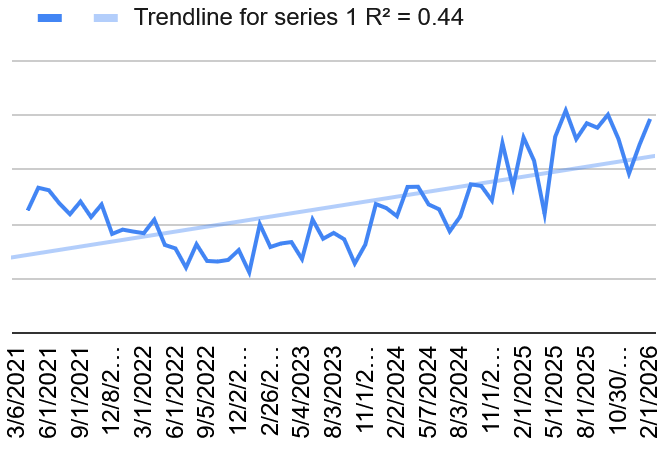
It is kind of crazy to see how much I spend in a year. I do want to say that every year I am maxing out my 401k, IRA and HSA and am dumping funds into personal brokerage and HYSAs to save for a house, so it’s not like my net worth is not growing. As a matter of fact, that is something I track on a monthly basis and will include some screenshots of those graphs for those interested.
I noticed that from 2023 to 2024 and to 2025 my Net Venmo Transactions (NVT) remained almost identical. That was quite shocking and interesting. I have also learned that feeding my transactions to AI to tally up for me is so incredibly useful – it saved me at least an hour.
Also of note, my main job’s salary has increased ~15% since the start of 2024 so I am outpacing the growth of my spend in income. That also does not include the income from the kind Patrons of the Podcast, Discogs income (growing modestly) and other MS avenues.
I like to think of myself as modestly stingy/frugal – if I can save a buck I will try to but am a sucker for a deal, nice clothes, and not feeling limited on my spending. But then again I have a 12 year old car and take the bus/train whenever I can. This is all to say that again I can probably use to spend less but I am seeing good results so I am not too stressed.
Also also, I realize I am subtracting my cash back earned from my spend but also excluding the MS that incurred a lot of that cash back from my totals. Even if I were to exclude that MS cash back ($3,270.46), my spend is still down substantially from last year. I call 2025 a win!
Graphs
Final Notes
I hope you find this interesting! If you have any advice on how I can make this better or want more info on my spreadsheets please reach out, contacts on the footer as always. Thank you for reading and your support, it means the world ❤
Below is taken from my original post in 2022 but I felt it was worth adding here again
Spaghetti Soup
What exactly is that bottom line? That is Total Spend with Rent – Total Cash Back – Sign up Bonuses – Rent Cash Back – Net Venmo Transactions – Shopping Portal Cash Back – Manufactured Spend – Remaining GC Balance. This gives us our Non-Manufactured Spend (NonMST) total
The Tracker
This is my third edition of the tracker. The first one was much more rudimentary. The second one was very similar to this years but had estimates for CC rewards tracking. For 2022 I went through each card and calculated the cash back I earned for each of the categories.
Getting Spend Totals
To populate the tracker, some of it is done by hand but most of it is pulled from the CC companies. In my experience, banks handle end of year spend summaries in three different ways
- Downloadable Transactions Spreadsheet: Banks like Chase, Citi and Elan allow you to download csv’s of your transactions for the entire year. These are the easiest and most manipulatable as they are already in a spreadsheet and contain merchant categories on each entry. This way I can do some sheets magic to group by matching category and add up my spend for that category
- PDF Year End Summary: Banks like Bank of America, Capital One, FNBO and Discover issue a Year End Summary in the form of a PDF. This is the second best way for me to get this data. I can’t just copy-paste it into my spreadsheet but I can copy over how they divided up my spend into categories and try to match it to the other banks categories
- Manual Aggregation: Smaller banks like Albert, Venmo (P2P not card), Oxygen, Cardless and Atlantic Federal Credit Union (AFCU) do not offer either of the above two options. This requires me to go through all of my statements for them and manually account for all of my spend, what category it was in and how much cash back I earned on them. This is mostly a labor of love
Other Values
After completing all of the CC tracking, the total spend number was honestly surprising. I then went into thinking of how this number could artificially inflated. This is why I added my Net Venmo Transactions (NVTs). This is the total amount of money I received from friends and family repaying me for things I purchased for/with them on my cards. I have additional money I got via Zelle but I could not find an easy way to gather that data so I just left it
Rent cash back is from Enzo’s $20/m on my rent payments. I also got into cashback portals, mainly MealKit purchase, which you can read a bit more about here

Leave a comment